In this tutorial you will learn how to use the multiple instances features of the FreqAnalyst Multi spectrum analysis plugin to provide you with visual help for mixing. This tutorial is based on a very simple project with bass, drums and vocal tracks. It is of course applicable to much more complex audio projects. We will be using FL Studio as a host application, but you can use any DirectX or VST plugins host application. Note that this tutorial is also applicable to other 'Multi' analysis tools such as the Blue Cat's StereoScope Multi plugin.
The Blue Cat's FreqAnalyst Multi multiple instances analysis plugin is based on the following principle (click for full size):

Step By Step
01 - Insert the FreqAnalyst Pro plugin on each track you are interested in:

02 - Click on the routing button to open the routing panel:

03 - On the drums track we choose to assign the instant response of the Max channel to curve 1:

04 - On the bass track, we choose mono mode and asign the instant spectrum to curve 4:

05 - On our voice track (which contains stereo loops), we assign the left channel to curve 6 and right channel to curve 14:
, we assign the left channel to curve 6 and right channel to curve 14.png "Step 05 - On our voice track (which contains stereo loops), we assign the left channel to curve 6 and right channel to curve 14")
06 - we need more precision for the voices, so let's increase the precision of the analysis (set to 9):
.png "Step 06 - we need more precision for the voices, so let's increase the precision of the analysis (set to 9)")
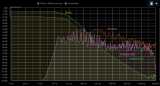
07 - hit play - you can now visualize the selected tracks spectrums in real time on a single graph:

You are now able to configure the FreqAnalyst Multi plug-in to visualize the spectrum of several audio tracks on the same screen. This is particularly interesting when recording and mixing, to avoid spectrum overlap between tracks. You can now tweak the settings offered by the plugin to adapt the analysis to each track and apply this tutorial to larger audio projects.
You can also use the same principle with other analysis tools such as the Blue Cat's StereoScope Multi plug-in or the Blue Cat's Oscilloscope Multi plug-in.
Any questions, comments? You want to submit your own tutorial to win a free license? Please post on our Forum!